GroovyMorning_RLAC
Radio AI Benchmarking: How to Measure the Efficiency of a Segmentation Algorithm?
Evaluating an AI’s understanding of radio requires a rigorous framework. This framework was established to compare different segmentation methods (LLM vs. Machine Learning vs. Audio).
The Entry Point: The JSON Results File
Before performance analysis, each detection model must produce a results file in a standardized JSON format. This file serves as an interface contract between the AI engines and the evaluator. It lists detected chronicles with the following properties:
[
  {
    "label": "The 7am News",
    "start": 120.5,           // Start of the chronicle (in seconds)
    "end": 240.0,             // End of the chronicle (in seconds)
    "detected_at": 135.2,     // Precise moment of AI confirmation
    "confidence": 0.95        // Model confidence index
  }
]
The evaluator then compares this file to a Ground Truth, containing actual timestamps validated by a human, to calculate precision and latency scores.
The Two Pillars of Performance
Evaluating an algorithm is not limited to simple chronicle detection. Two critical dimensions are measured:
1. Temporal Fidelity (IoU)
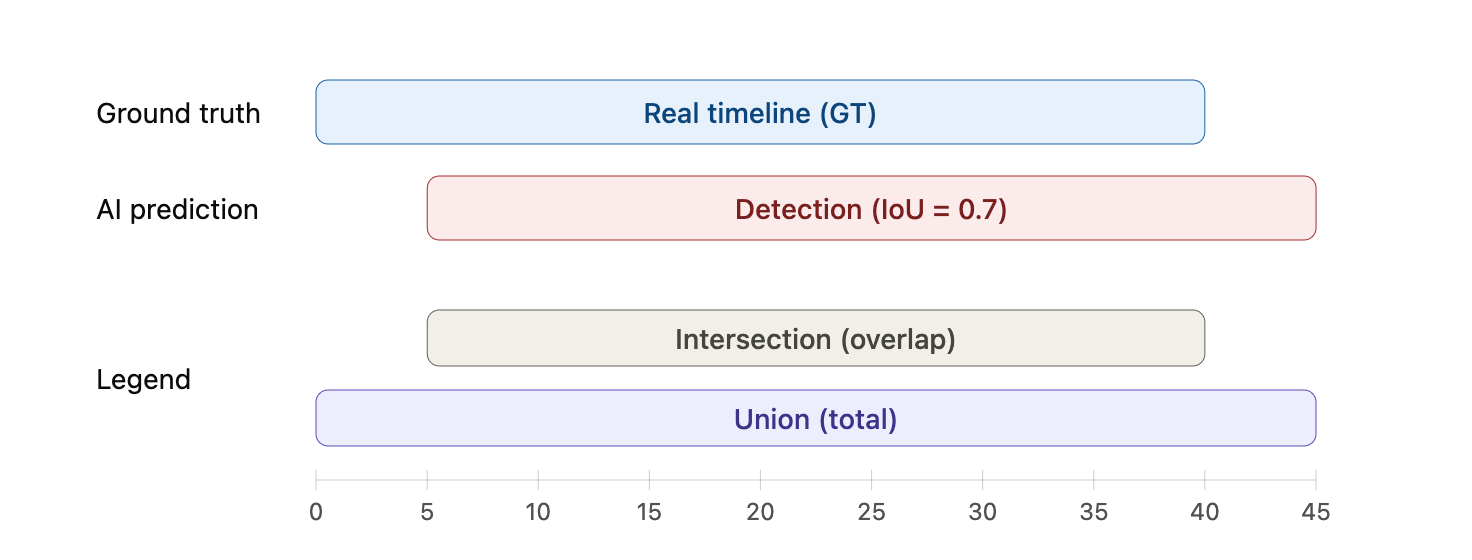
The IoU (Intersection over Union) metric is used. It mathematically measures the overlap between the AI’s prediction and the “Ground Truth” established by a human.
- An IoU of 1.0 corresponds to an exact match between detection and reality.
- A segmentation is considered too imprecise if the IoU is below 0.5.
2. Latency (Responsiveness)
For a live application, responsiveness is crucial. The delay between the actual start of the chronicle and the emission of the confirmation notification by the AI is therefore measured.
The Score out of 100
Models are ranked using a weighted formula:
- 60% of the score is based on IoU (segmentation precision).
- 40% of the score is based on latency (speed).
Bonus points are awarded for a reaction in less than 5 seconds, while a delay exceeding 60 seconds cancels the “latency” component of the score.
“Label-Agnostic” Mode
An “Agnostic” option allows checking if the system detects a change on air, even if the chronicle name identification is wrong. A detection is validated if it temporally corresponds to a real chronicle, regardless of its label. This mode is particularly suitable for testing silence detection algorithms or generic jingles.
Visualization of Results
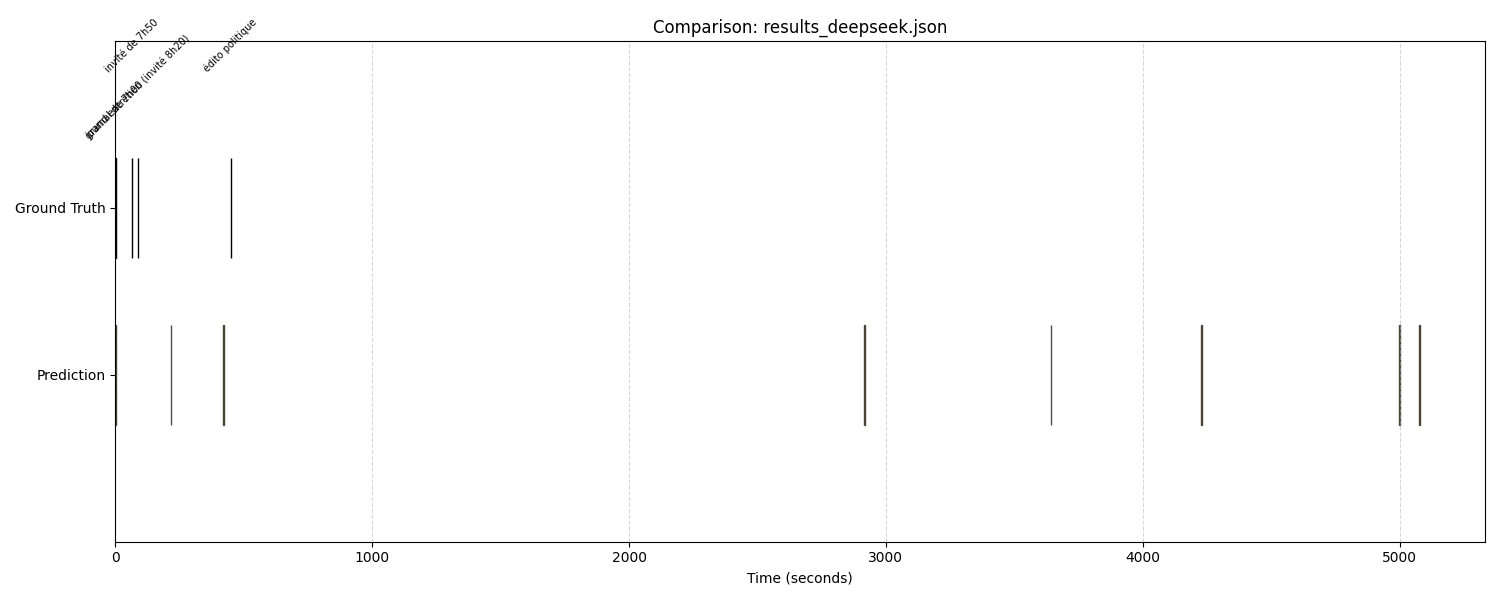
A visual diagnostic module allows visualizing the performance of radio chronicle detection models.
Main Goal
It transforms complex data files (JSON/TXT) into a timeline, allowing at-a-glance comparison of the actual location of chronicles versus model detections.
Visual Functioning
- Ground Truth Line: Displays thin colored vertical bars marking exactly the start of each expected chronicle.
- Prediction Line: Displays orange blocks representing the full duration detected by your model.
Results and Observations
Using this testbed has allowed observing certain trade-offs:
- LLMs (like DeepSeek) offer excellent IoU (> 0.9) thanks to fine context understanding, at the cost of sometimes high latency (15-20 s).
- Lightweight Audio models are almost instantaneous (< 2 s) but can be misled by advertisements or unusual show structures.
This framework allows guiding GroovyMorning development through data, by selecting the most suitable model for each use case.